Initiating coverage | JK Cement
March 12, 2015
JK Cement
BUY
CMP
`673
New Capacity addition to drive growth
Target Price
`778
Capacity expansion to drive growth: JK Cement (JKCem), a JK organization group
Investment Period
12 Months
company, has a grey cement capacity of 10.5mtpa catering to the markets of
North, West and South regions of India. 7.5mtpa of its plant capacity is located in
Stock Info
the North region (Rajasthan and Haryana) and the remaining 3mtpa is located in
Sector
Cement
the South region (Karnataka). This includes newly added capacity of 3mtpa in
Market Cap (` cr)
4,706
North India, comprising of 1.5mtpa split grinding unit each in Haryana and
Net debt (` cr)
2,434
Rajasthan, translating into an increase in capacity by 40%. JKCem started
Beta
1.3
production from these newly set up units during 1HFY2015. We expect production
52 Week High / Low
754 / 199
from these new plants to ramp up during FY2016. The Management guided that
Avg. Daily Volume
132,293
new plants’ utilization levels will reach
85%+ in the next two years. The
Face Value (`)
10
company’s North India plant (excluding new plant) is operating at 90% capacity
BSE Sensex
28,930
utilisation. Industry capacity expansion in the North region is expected to slow
Nifty
8,776
down going forward to 4.5% (CAGR) over FY2014-17 period as against the
Reuters Code
JKCE.BO
earlier capacity expansion rate of 5.8% CAGR over the FY2010-14 period. Hence we
Bloomberg Code
JKCE IN
believe that the output from JKCem’s new capacities (3mtpa) would be absorbed by the
market. We expect JKCem’s volume to grow at 16.4% CAGR during FY2014-17 on
account of the expanded capacity.
Shareholding Pattern (%)
Top 2 players in White cement business: JKCem has white cement capacity of
Promoters
66.9
0.6mtpa in Gotan, Rajasthan. There are only two major players manufacturing
MF / Banks / Indian Fls
9.5
white cement, one being JK Cem itself and the other being UltraTech Cement.
FII / NRIs / OCBs
16.6
Thus the utilization level is healthy led by stable demand for white cement. White
Indian Public / Others
6.9
cement contributed 31% to the top-line of JKCem in FY2014. White cement’s
EBITDA margins are higher and consistent at 25-28%, while the margins in grey
Abs.(%)
3m 1yr 3yr
cement have been volatile over the years. The company has doubled its white
Sensex
3.8
31.6
68.9
cement capacity to 1.2mtpa by starting production at the 0.6mtpa plant in UAE.
JK Cement
15.0
222.0
400.0
We expect white cement standalone business volume to grow at a CAGR of 7.0%
over FY2014-17 period.
Valuation: At CMP of `673 the stock is trading at 10.4x and 7.7x its FY2016E and
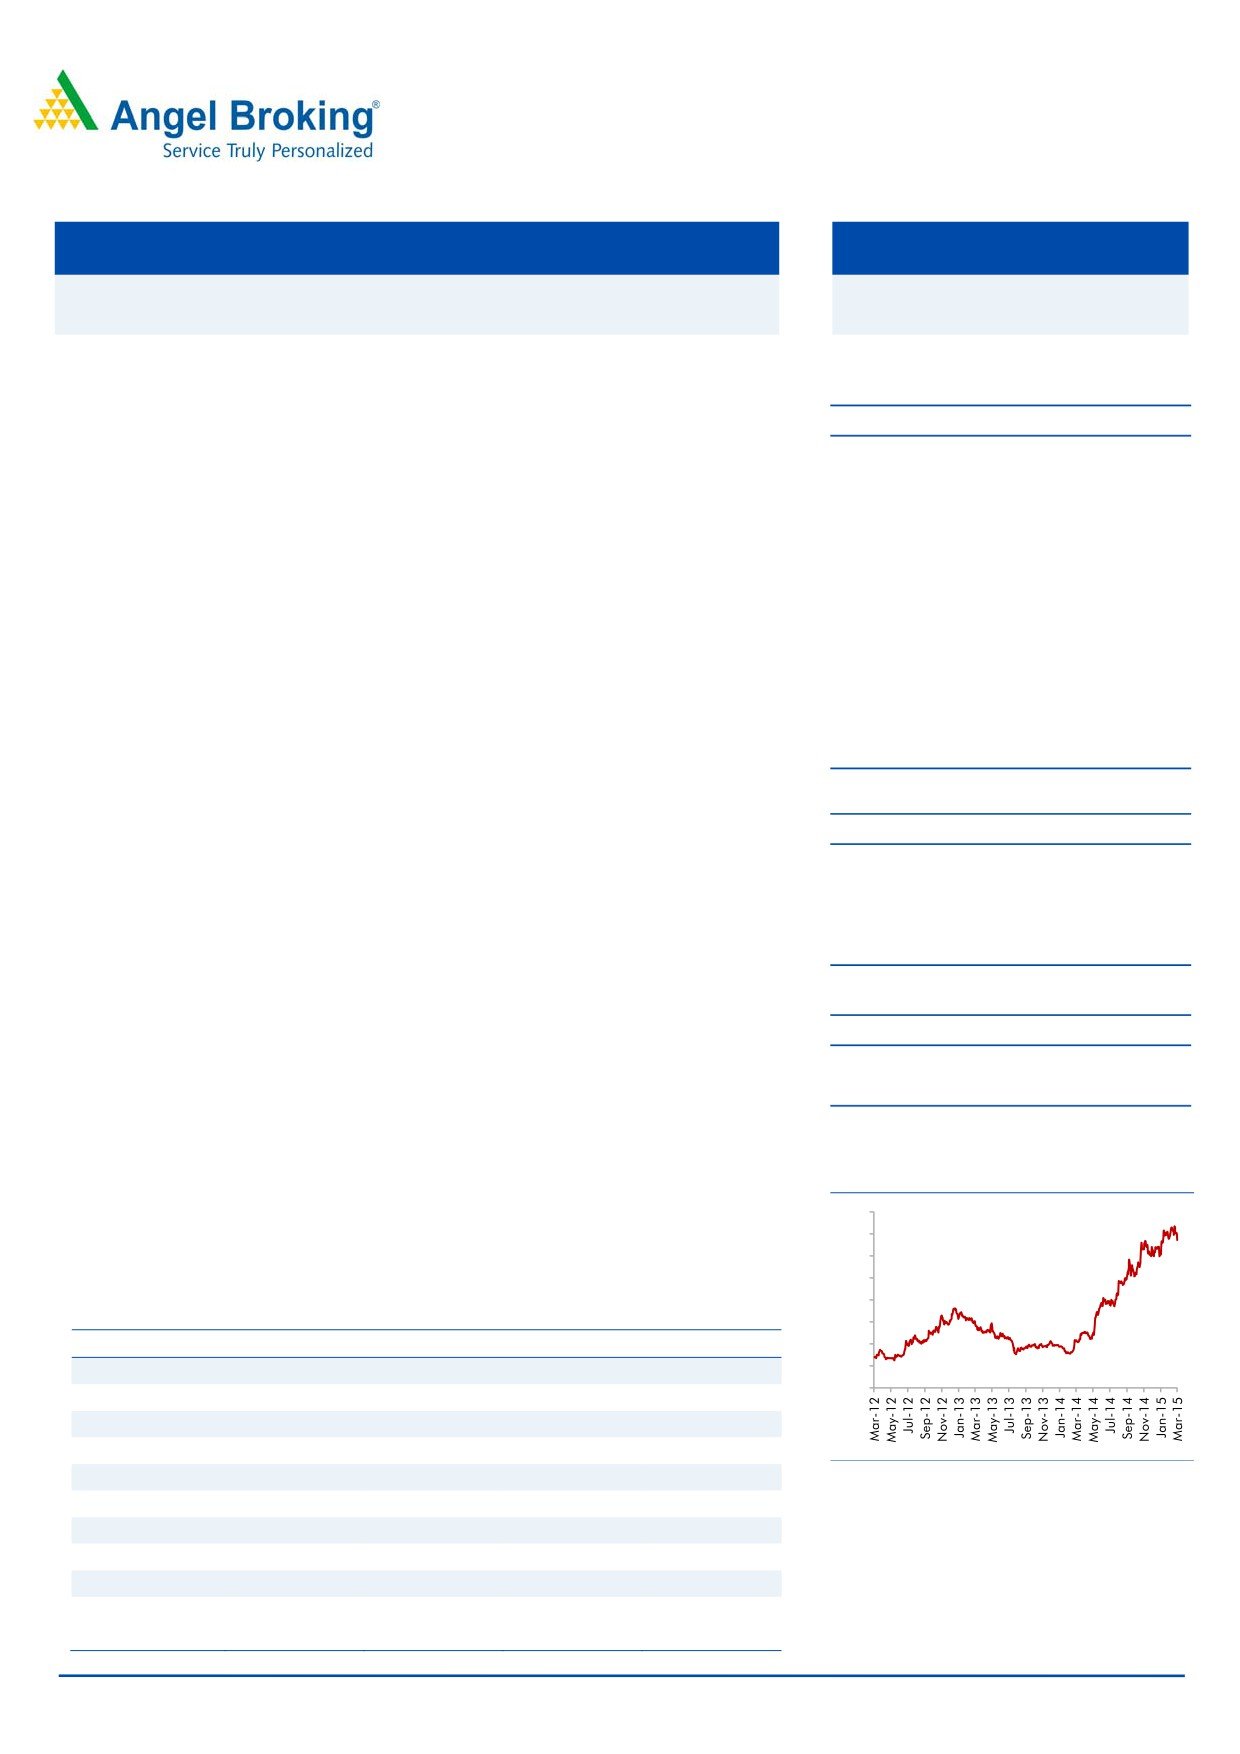
3-Year Daily price chart
FY2017E EV/EBITDA (blended), respectively. We initiate coverage on JK Cement
800
with a Buy recommendation and target price of `778 based on 8.0x grey cement
700
and 9.0x white cement FY2017 EV/EBIDTA; the target price implies EV/tonne of
600
500
$100 (on blended capacity of 11.6mtpa).
400
Key Financials (Standalone)
300
Y/E March (` cr)
FY2014
FY2015E
FY2016E
FY2017E
200
100
Net Sales
2,782
3,378
4,077
4,772
0
% chg
(4.2)
21.5
20.7
17.0
Net Profit
97
120
157
297
% chg
(58.5)
23.2
31.1
89.9
EPS (`)
14
17
22
43
Source: Company, Angel Research
P/E (x)
48.5
39.4
30.0
15.8
P/BV (x)
2.7
2.5
2.4
2.1
RoE (%)
6.4
7.0
8.2
14.3
RoCE (%)
5.8
6.5
10.1
13.8
Shrenik Gujrathi
EV/Sales (x)
2.0
2.1
1.7
1.4
022 39357800 Extn: 6872
EV/EBITDA (x)
15.4
15.7
10.4
7.7
Source: Company, Angel Research; Note: CMP as of March 12, 2015
Please refer to important disclosures at the end of this report
1
Initiating coverage | JK Cement
Investment Arguments
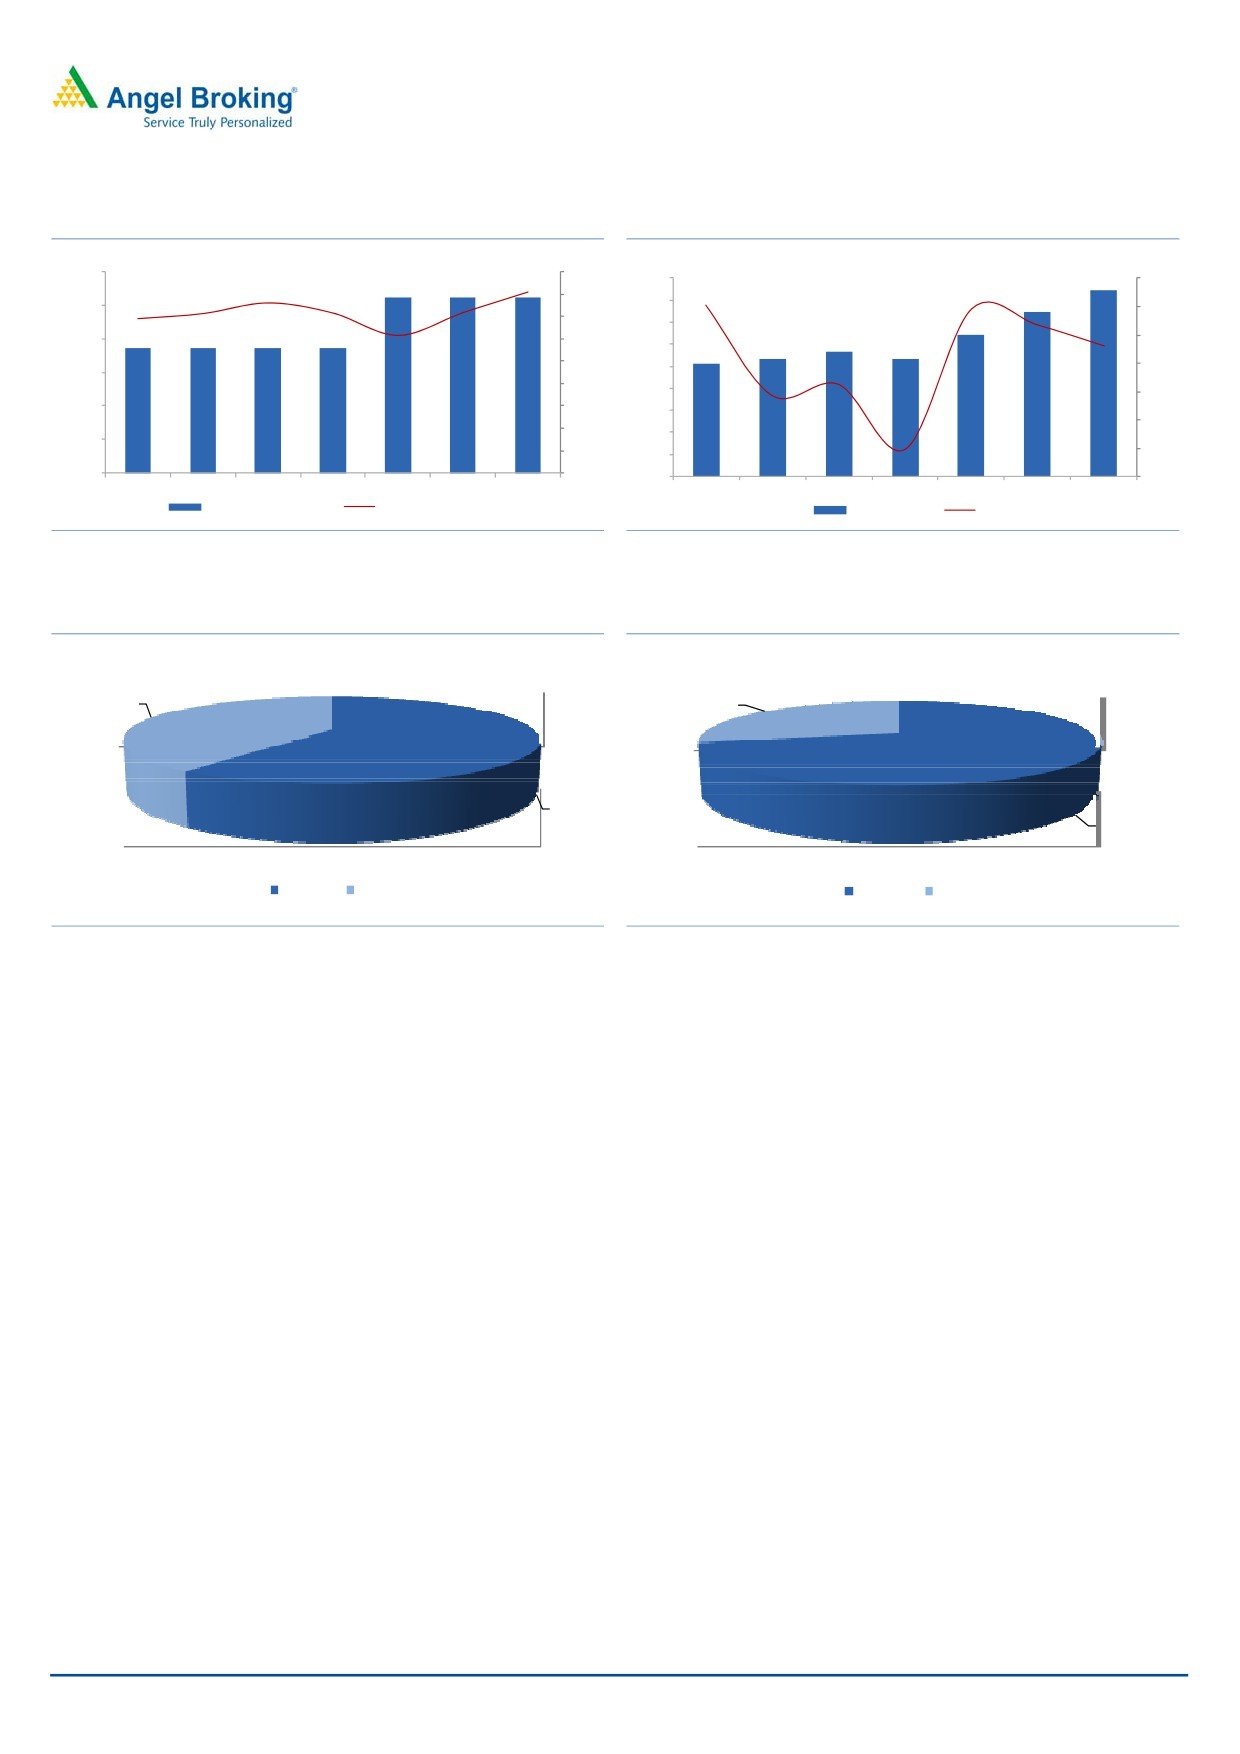
Capacity expansion to drive growth: JKCem has expanded its grey cement capacity
by 40% from 7.5mtpa to 10.5mtpa (7.5mtpa in North India and 3mtpa in South
India). This includes newly added capacity of 3mtpa capacity in North India,
comprising addition of 1.5mtpa split grinding unit each in Haryana and Rajasthan.
JKCem has started production at these units during 1HFY2015. We expect
production to ramp up during FY2016. The Management guided that the new
plants’ utilization levels will reach 85%+ in the next two years. The company’s
North India capacity (excluding the new plants) is operating at 90% utilization
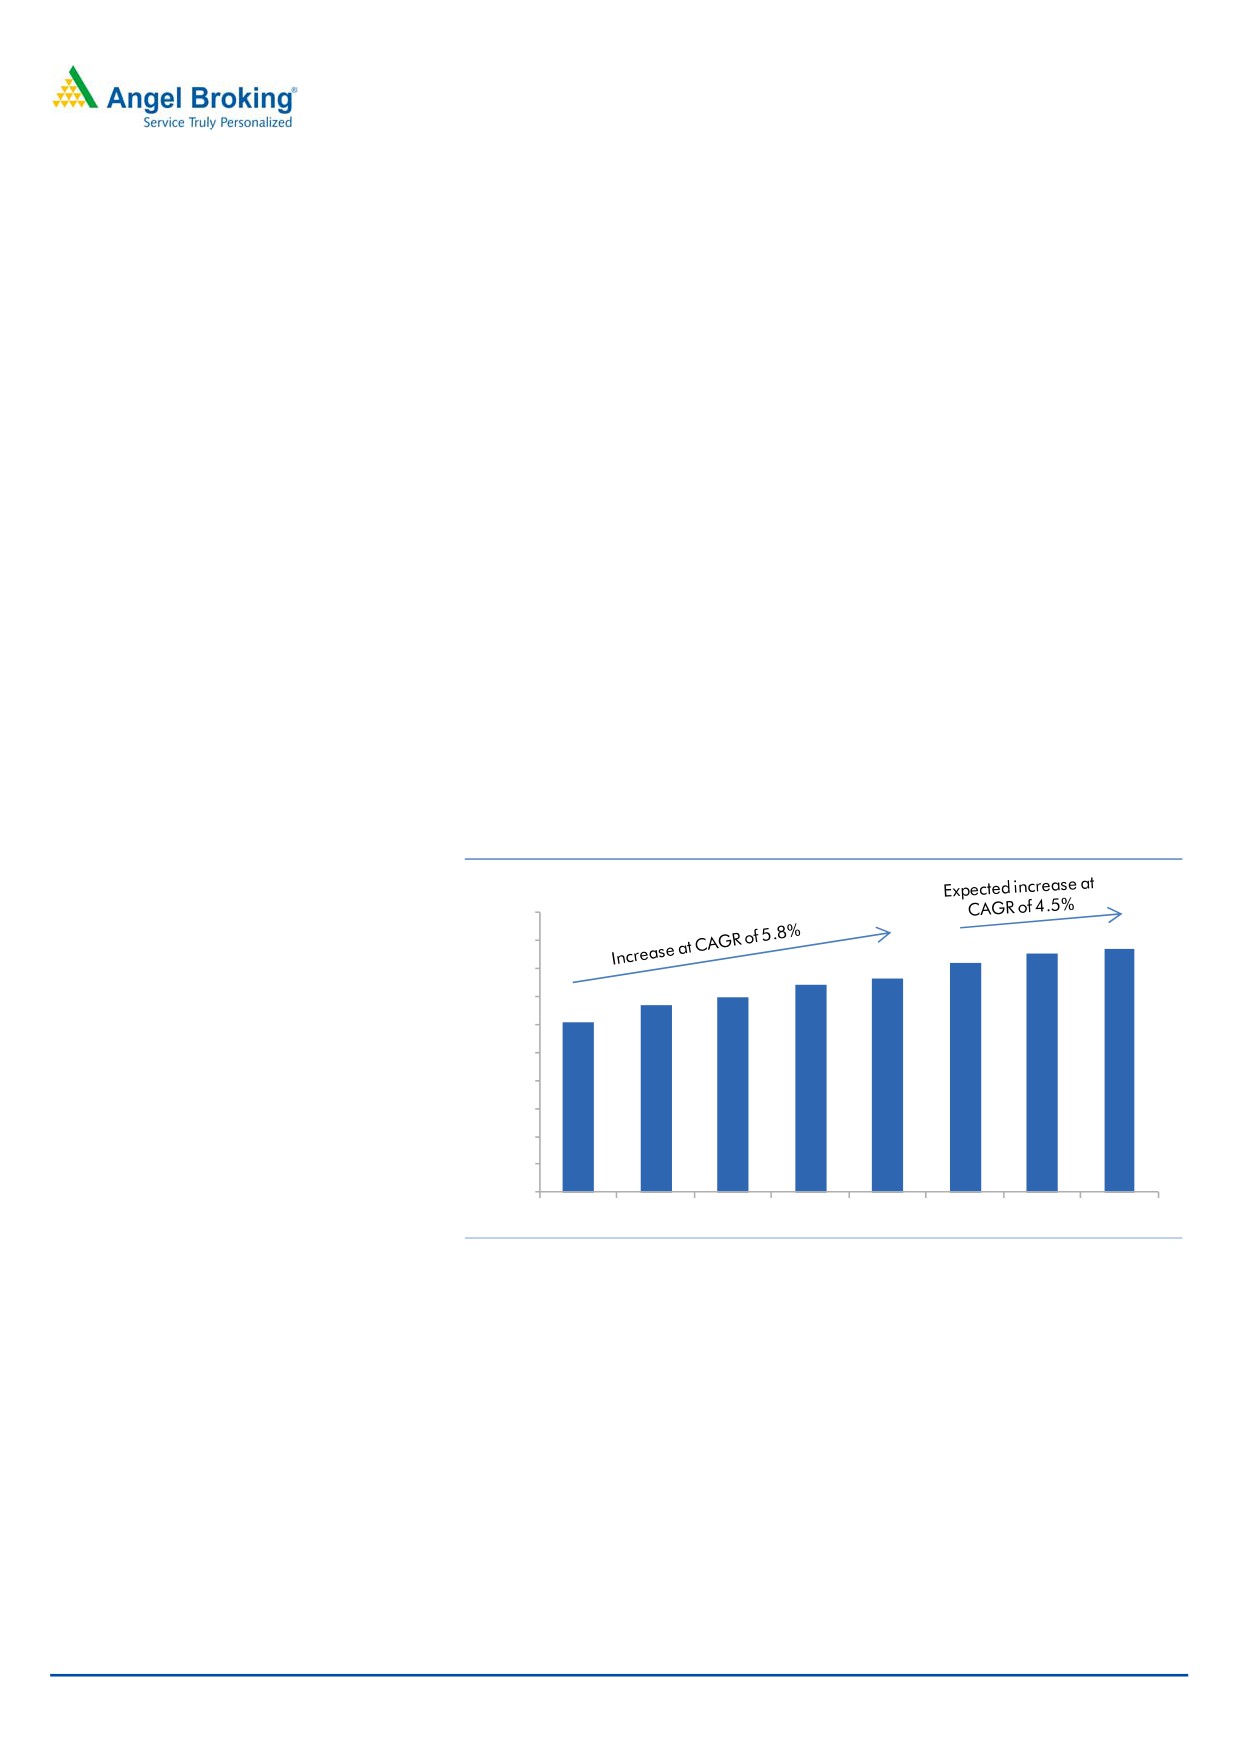
levels. Industry capacity expansion in the North region is expected to slow down to
4.5% (CAGR) over the FY2014-17 period as against the earlier growth rate of
5.8% CAGR over the FY2010-14 period. Hence we expect output from the new
capacities (3mtpa) to be absorbed by the market.
We expect JKCem’s volume to grow at 16.4% CAGR over FY2014-17. The
ongoing capex cycle is over with 10MW waste heat recovery plant and railway
sliding at new plant getting operational in December 2014. Now JKCem is
expanding its white cement based wall putty plant of 0.2mtpa in Madhya Pradesh,
which would be operational by FY2017. The total capex required to be incurred on
this plant would be `100-150cr.
Exhibit 1: Industry Capacity expansion in North Region
(mn tn)
100.0
85.2
86.9
90.0
81.7
76.2
80.0
74.2
69.8
67.0
70.0
60.8
60.0
50.0
40.0
30.0
20.0
10.0
0.0
FY10
FY11
FY12
FY13
FY14
FY15E FY16E FY17E
Source: Company, Angel Research
March 12, 2015
2
Initiating coverage | JK Cement
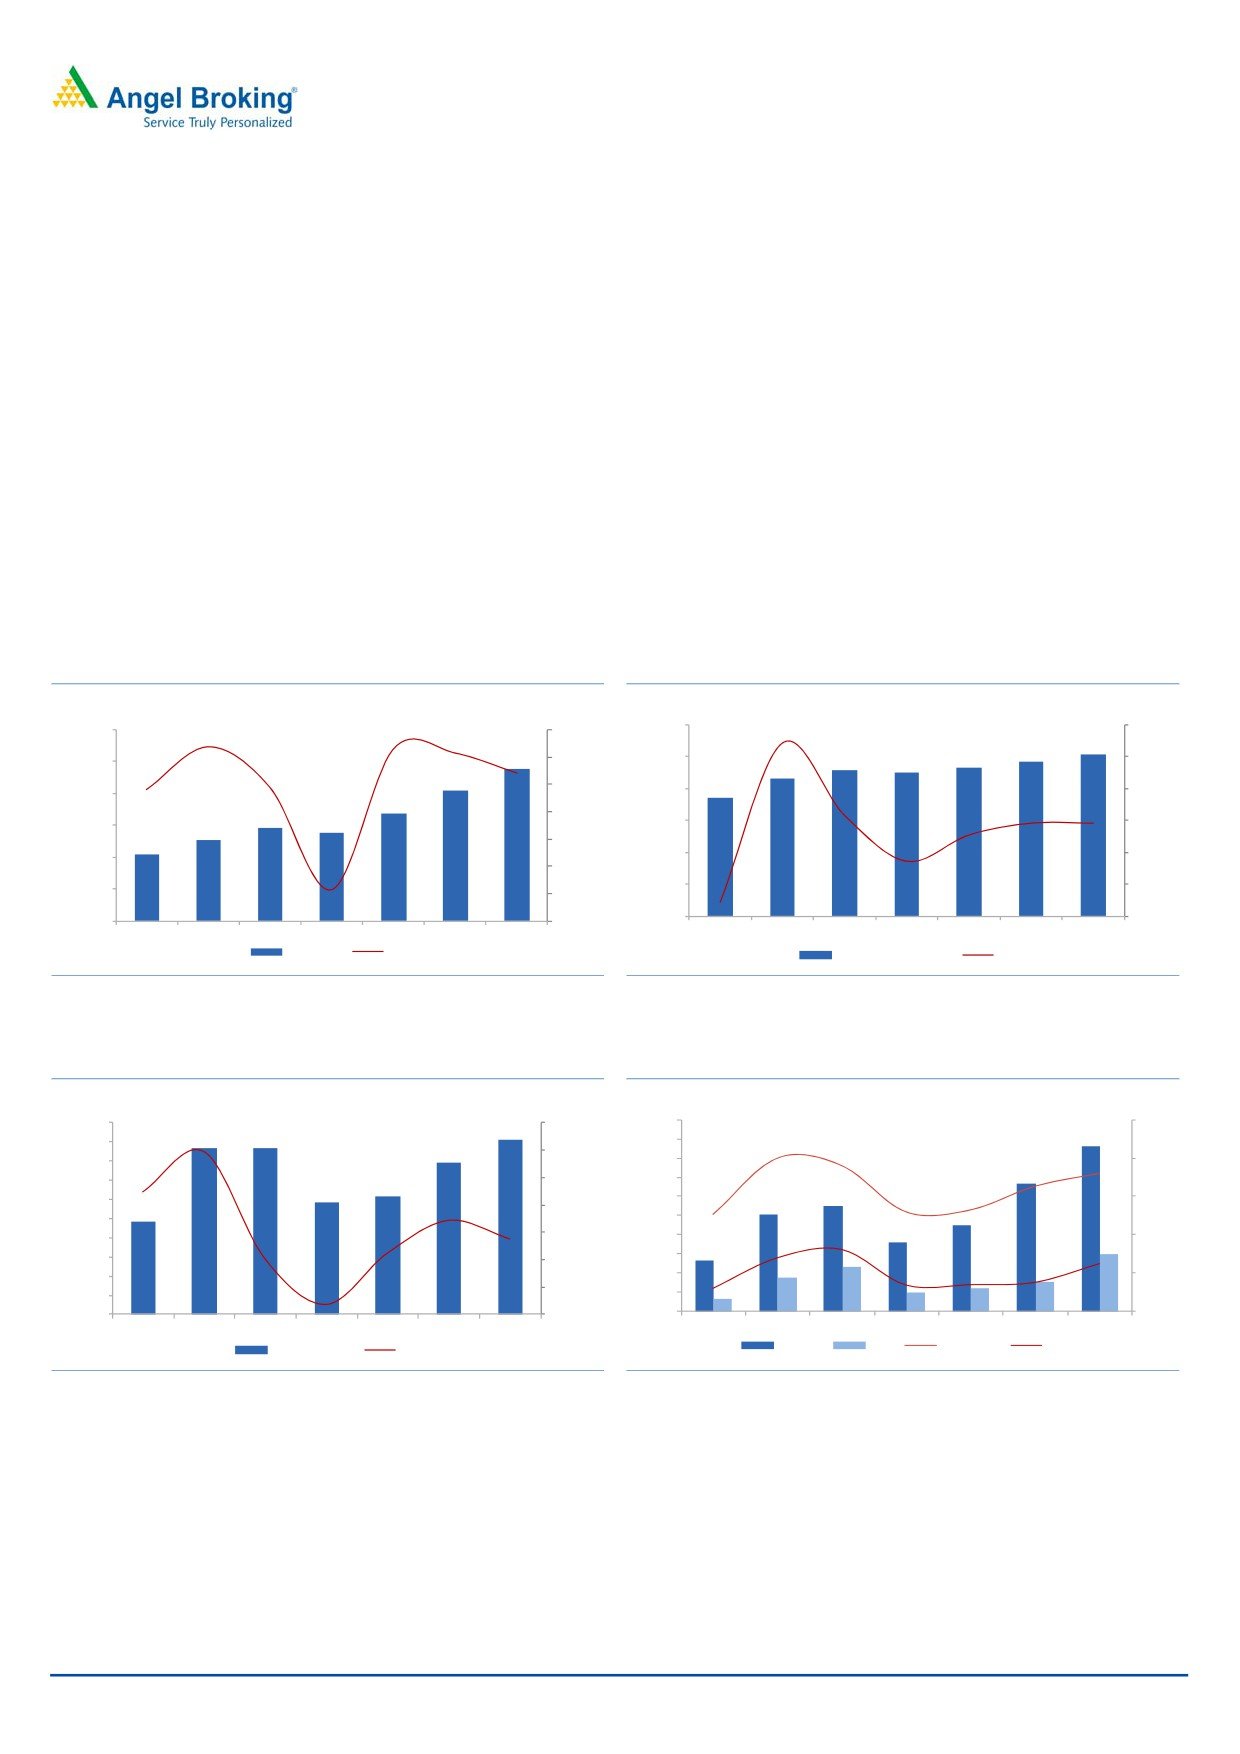
Exhibit 2: Grey Cement capacity and utilization level
Exhibit 3: Grey cement volume growth trend
(mn
tn)
(%)
(mn
tn)
(%)
12.0
90.0
80.9
9.0
25.0
76.0
80.0
19.5
71.2
71.6
8.0
10.0
68.9
71.5
20.2
20.0
61.4
70.0
7.0
16.7
8.0
60.0
8.4
15.0
6.0
13.
0
7.5
50.0
5.0
6.4
10.0
6.0
5.7
5.3
5.4
7.5
7.5
10.5
10.5
10.5
40.0
7.5
7.5
4.0
6.2
5.0
4.0
30.0
5.1
3.0
4.2
0.0
20.0
2.0
2.0
10.0
(5.3)
-5.0
1.0
0.0
0.0
0.0
-10.0
FY11
FY12
FY13
FY14
FY15E
FY16E
FY17E
FY11
FY12
FY13
FY14
FY15E
FY16E
FY17E
Capacity(mn tonnes)
Capacity utilization(%)
Sales Volume
yoy%
Source: Company, Angel Research
Source: Company, Angel Research
Exhibit 4: Pre Expansion Grey cement capacity
Exhibit 5: Post Expansion Grey cement capacity
40%
29%
60%
71%
North
South
North
South
Source: Company, Angel Research
Source: Company, Angel Research
March 12, 2015
3
Initiating coverage | JK Cement
Top 2 players in White cement business: JKCem has a white cement capacity of
0.6mtpa in Gotan, Rajasthan. There are only two major players manufacturing
white cement, one is JKCem itself and the other being UltraTech Cement. Thus, the
utilization level is healthy, led by stable demand for white cement. White cement
contributed 31% to JKCem’s top-line in FY2014. White cement realization is
almost 2.5x times that of grey cement in FY2014; white cement realization was
`10,706 while that of grey cement realization was `3,591. White cement’s EBITDA
margins are higher and more consistent at 25-28% while grey cement’s margins
have been volatile over the years.
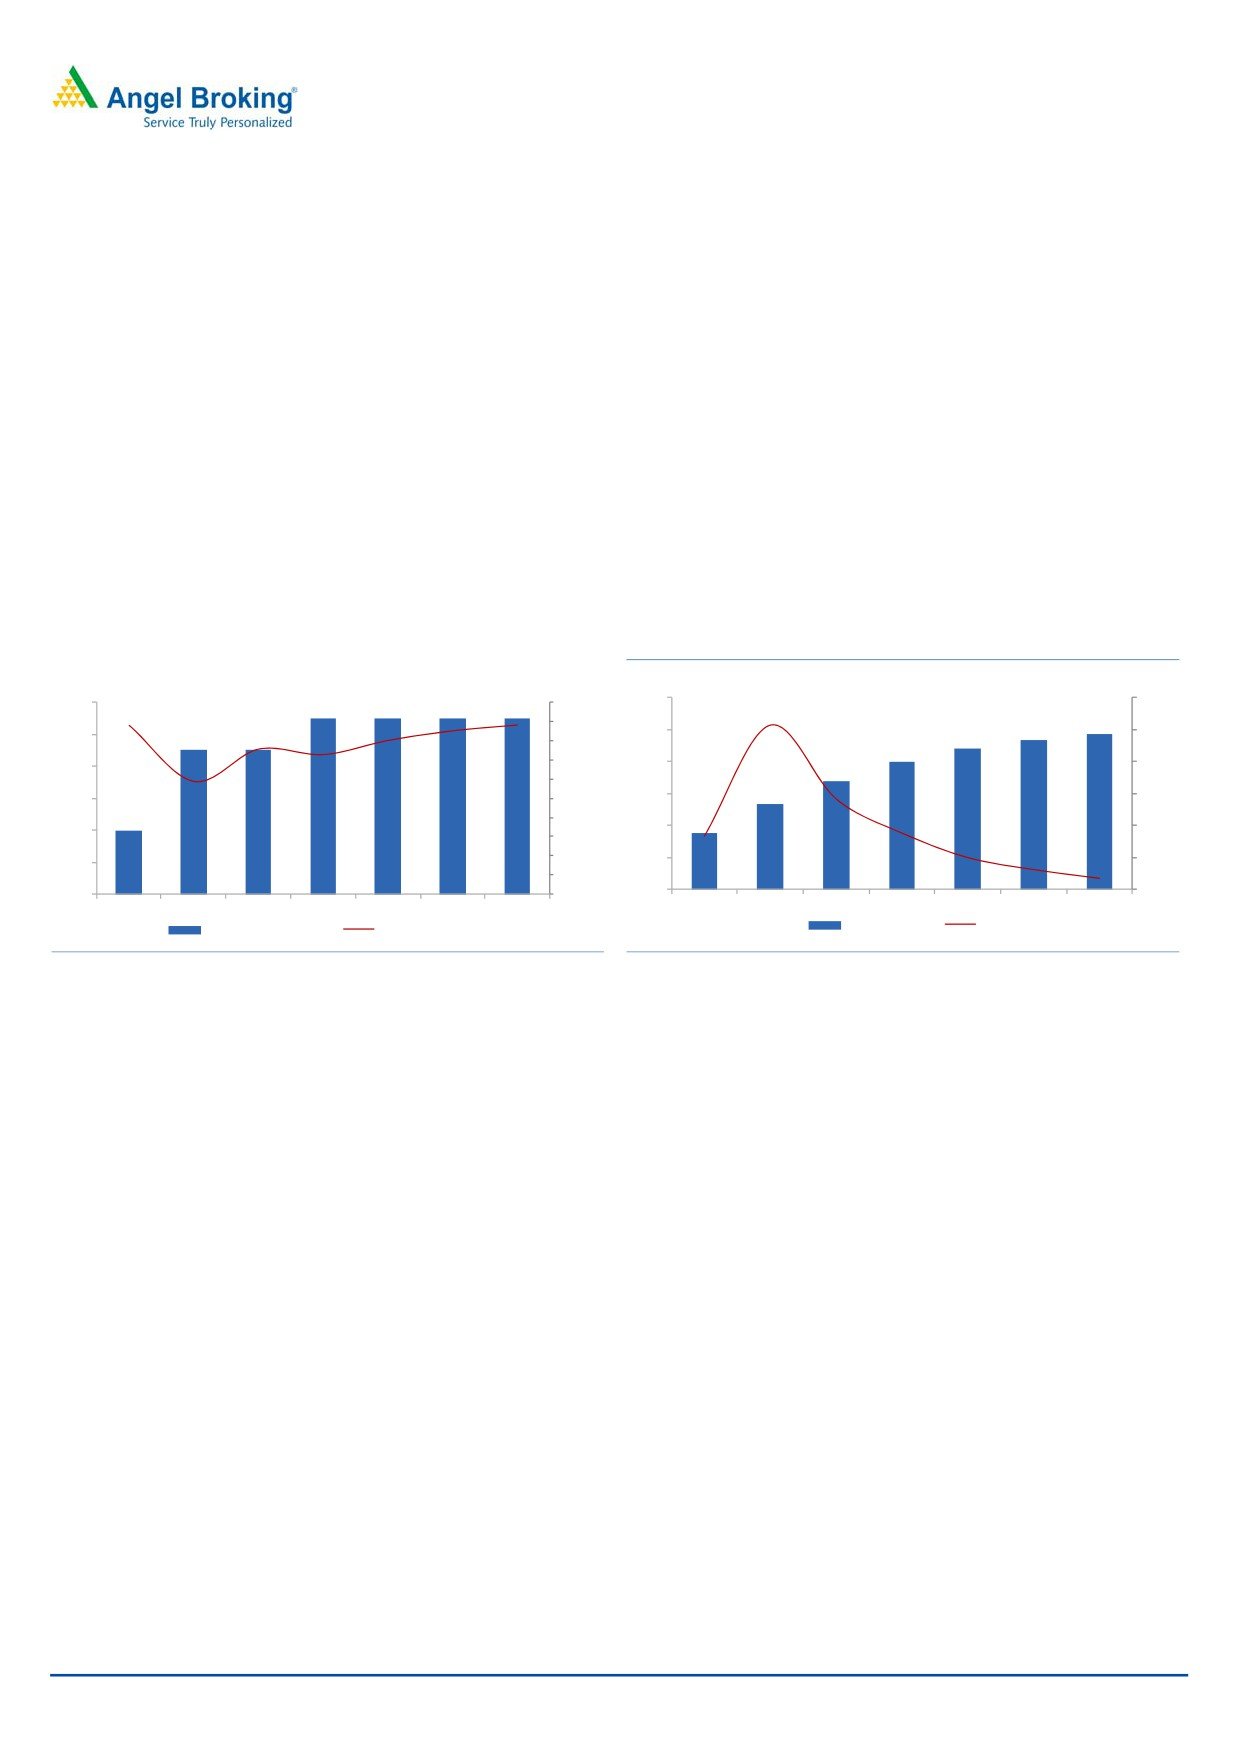
The company has doubled its white cement capacity to 1.2mtpa by starting
production at a 0.6mtpa plant in UAE. We expect white cement volume to grow at
a CAGR of 7.0% over FY2014-17. As white cement has steady demand, we expect
realization to remain strong and grow at a CAGR of 3.4% over FY2014-17.
Exhibit 6: White Cement+Putty capacity and utilization level
Exhibit 7: White cement+Putty volume growth trend
(mn
tn)
(%)
(mn
tn)
(%)
1.2
60.0
1.2
100.0
85.0
80.0
88.090.0
51.3
87.8
1.0
50.0
1.0
80.0
1.72.7
70.0
0.8
0.9
1.0
40.0
0.8
0.9
0.9
75.6
60.0
0.8
58.9
1.1
1.1
0.6
30.0
0.6
1.1
50.0
28.3
0.9
40.0
0.7
0.4
0.4
0.5
20.0
30.0
16.7
17.6
0.4
20.0
0.2
0.4
10.0
10.0
0.2
6.3
10.0
3.5
0.0
0.0
0.0
0.0
FY11
FY12
FY13
FY14
FY15E
FY16E
FY17E
FY11
FY12
FY13
FY14
FY15E
FY16E
FY17E
sales volumes
yoy %
Capacity(mn tonnes)
Capacity utilization(%)
Source: Company, Angel Research
Source: Company, Angel Research
March 12, 2015
4
Initiating coverage | JK Cement
EBITDA to grow multifold on back by margin improvement: We expect JKCem’s
net sales to grow at a CAGR of 19.7% over FY2014-17, backed by strong volume
and healthy realization growth. The new plant addition will improve efficiency and
lead distance will be reduced as these plants are in close vicinity to the market. As
a result, freight cost is expected to come down. The plant will also enjoy 50% VAT
exemption for the next seven years for the goods sold in their respective states of
manufacture, ie Rajasthan and Haryana. Therefore we expect EBITDA to grow at a
CAGR of 33.6% over FY2014-17 on back of strong top-line growth and
operational efficiency. The EBITDA/tonne is also expected to improve from `585 in
FY2014 to `913 by FY2017. We expect blended margins to expand significantly
from 13.0% in FY2014 to 18.0% in FY2017.
Exhibit 8: Realization per tonne comparison
Exhibit 9: Total cost per tonne comparison
Company
FY2010
FY2011
FY2012
FY2013
FY2014
Company
FY2010
FY2011
FY2012
FY2013
FY2014
Shree Cement
3,457
3,233
3,677
3,760
3,738
Shree Cement
2,351
2,724
2,994
3,268
3,163
Ramco Cement
3,330
3,389
4,098
4,339
4,076
Ramco Cement
2,422
2,721
3,082
3,335
3,633
India Cement
3,351
3,380
4,209
4,362
4,180
India Cement
2,804
3,088
3,466
3,735
3,892
JK Lakshmi
3,192
2,979
3,461
3,772
3,452
JK Lakshmi
2,288
2,576
2,943
3,068
3,117
JK Cement*
3,503
3,234
3,753
3,836
3,591
JK Cement*
3,046
3,329
3,464
3,710
3,930
Source: Company, Angel Research
Source: Company, Angel Research
Exhibit 10: Raw material cost per tonne comparison
Exhibit 11: Freight cost per tonne comparison
Company
FY2010
FY2011 FY2012 FY2013 FY2014
Company
FY2010
FY2011
FY2012
FY2013
FY2014
Shree Cement
325
358
421
424
315
Shree Cement
487
639
709
742
837
Ramco Cement
496
535
581
626
803
Ramco Cement
594
646
744
920
961
India Cement
457
506
572
556
573
India Cement
563
715
793
954
1,006
JK Lakshmi
501
463
778
918
979
JK Lakshmi
542
598
701
795
812
JK Cement*
371
477
522
570
689
JK Cement*
827
882
833
946
1,028
Source: Company, Angel Research
Source: Company, Angel Research
Exhibit 12: Power cost per tonne comparison
Exhibit 13: EBITDA per tonne comparison
Company
FY2010
FY2011
FY2012
FY2013
FY2014
Company
FY2010
FY2011
FY2012
FY2013
FY2014
Shree Cement
651
960
1,056
1,227
970
Shree Cement
1,526
938
1,159
1,247
969
Ramco Cement
743
904
971
956
969
Ramco Cement
1,068
845
1,221
1,138
596
India Cement
952
1,022
1,150
1,249
1,272
India Cement
790
352
805
683
338
JK Lakshmi
623
889
876
766
750
JK Lakshmi
912
416
694
809
536
JK Cement*
903
1,014
1,117
1,126
1,094
JK Cement*
964
483
866
871
585
Source: Company, Angel Research
Source: Company, Angel Research
Note: JK Cement realization is for grey cement, while cost and EBITDA per tonne are on blended
basis (including white cement).
March 12, 2015
5
Initiating coverage | JK Cement
Financial outlook
We expect JKCem to report healthy 19.7% revenue CAGR over FY2014-17E. This
would be on the back of strong volume growth with new capacity having begun
operation during 1HFY2015, and better cement demand outlook which will lead to
higher realizations. We expect blended realization to grow at a CAGR of 3.9% over
FY2014-17. Blended realization per tonne will improve from `4,515 in FY2014 to
`5,070 in FY2017. In FY2014, the company’s EBITDA declined sharply by 34.7%
yoy to `361cr vs `552cr in FY2013, while its EBITDA margin declined to 13.0% vs
19.0% in FY2013 due to fall in realizations. Going forward we expect the EBITDA
margin to improve due to higher realizations and operational efficiency of the
company. The EBITDA margin is expected to improve from 13.0% in FY2014 to
18.0% by FY2017E. Overall we expect EBITDA to grow at a CAGR of 33.6% over
FY2014-17E. With better profitability, we expect JKCem’s RoE to improve from
current levels of 6.4% to 14.3% by FY2017E.
Exhibit 14: Revenue growth trend
Exhibit 15: Expected Blended Realization growth
(`
cr)
(%)
(`
mn/tn)
(%)
21.5
6,000
20.0
6,000
25.0
17.1
21.8
5,070
20.7
4,849
20.0
5,000
4,581
4,515
4,637
15.0
5,000
4,772
4,331
14.0
14.4
4,077
17.0
15.0
4,000
3,697
10.0
4,000
3,378
10.0
5.8
2.7
4.6
2,904
2,782
3,000
5.0
3,000
2,538
4.6
2,083
5.0
2,000
2,000
0.0
0.0
(1.4)
1,000
1,000
(5.0)
(4.2)
(5.0)
(7.8)
0
(10.0)
-
(10.0)
FY11
FY12
FY13
FY14
FY15E FY16E FY17E
FY11
FY12
FY13
FY14
FY15E FY16E FY17E
Net Sales
% chg
Blended Realization
yoy%
Source: Company, Angel Research
Source: Company, Angel Research
Exhibit 16: Expect improvement in EBITDA/tonne
Exhibit 17: Profitability Trend
(` cr)
(%)
(`
mn/tn)
(%)
1000
913
100.0
1000
25.0
900
860
900
20.0
79.4
80.0
800
20.0
800
866
871
19.0
792
666
18.0
700
49.9
60.0
700
552
13.2
16.3
600
600
12.7
508
13.0
15.0
614
40.0
585
28.9
500
448
500
483
20.0
400
361
10.0
400
15.3
8 .0
297
4.9
300
264
7.0
300
0.5
0.0
234
177
120
157
200
200
6.2
5 .0
3 .1
97
(20.0)
100
64
3.8
100
3.5
(32.8)
3 .5
0
(40.0)
0
0 .0
FY11
FY12
FY13
FY14
FY15E FY16E FY17E
FY11
FY12
FY13
FY14
FY15E
FY16E
FY17E
EBIDTA/tonne
% chg
EBITDA
PAT
EBITDA %
PAT %
Source: Company, Angel Research
Source: Company, Angel Research
March 12, 2015
6
Initiating coverage | JK Cement
Outlook and Valuation
The Indian cement industry has had a challenging time in the recent past due to
overcapacity and lack of demand. Going forward, as the macro economy
improves and with the government’s renewed focus on housing and infrastructure,
the demand scenario for the cement industry is expected to improve as well. With
the pace of capacity addition slowing down, we expect utilization levels to improve,
going forward. Companies which have added capacity in the recent past or are on
the verge of project completion are to benefit the most from this demand pick up.
At CMP of `673 the stock is trading at 9.9x and 7.5x its FY2016E and FY2017E
EV/EBITDA (blended), respectively. We initiate coverage on JK Cement with an Buy
recommendation and target price of `778 based on 8.0x grey cement and 9.0x
white cement FY17 EV/EBIDTA; the target price implies EV/tonne of $100 (on
blended capacity of 11.6mtpa).
Exhibit 18: JK Cement SOTP valuation
(` in cr)
EV/EBITDA
FY2017E
Grey Cement
8.0
4500
White Cement
9.0
2675
Overseas Operation
8.0
700
EV
7875
Consolidated Net Debt
2434
Market cap
5441
Target Price (`)
778
Upside
16%
CMP (`)
673
Source: Company, Angel Research
Exhibit 19: Valuation Table
Rating
CMP Target Price
P/E (x)
EV/EBITDA (x)
EV/tn (USD/tn)
Company
(`)
(`)
FY15E FY16E FY17E FY15E FY16E FY17E FY15E FY16E FY17E
ACC
Neutral
1,650
1,656
36.1
26.3
18.6
18.4
13.7
10.2
141
129
129
Ambuja Cement Neutral
264
234
28.2
27.1
23.5
18.7
14.8
12.8
207
206
204
India Cements
Buy
99
146
84.5
27.3
16.6
11.8
7.6
6.5
73
65
63
JK Lakshmi Cem Buy
379
443
25.9
20.8
13.6
13.1
9.1
7.2
105
94
88
Mangalam Cement Buy
289
360
23.5
11.8
8.3
9.3
6.3
4.8
43
45
42
Orient Cement
Neutral
176
183
22.1
23.2
14.3
10.6
10.0
7.3
95
90
85
The Ramco CementAccumulate
321
350
40.1
23.9
16.1
15.8
11.4
8.5
114
108
99
Shree Cement
Neutral
10,700
9,852
43.0
46.9
31.0
25.5
18.3
13.5
303
250
221
Ultratech Cement Buy
3,001
3,534
36.0
24.6
18.6
18.6
13.5
10.5
221
194
175
JK Cement
Buy
673
778
39.4
30.0
15.8
15.7
10.4
7.7
100
98
94
Source: Company, Angel Research
March 12, 2015
7
Initiating coverage | JK Cement
Company Background
JK Cement is one of the leading cement producers in India with installed grey
cement capacity of 10.5mtpa (7.5mtpa capacity is located in the North region
[Rajasthan and Haryana] and the remaining 3mtpa capacity is located in the South
region [Karnataka]). JKCem is the second largest white cement producer in India
with installed capacity of 0.6mtpa. The company also has a 0.5mtpa wall putty
capacity in Gotan, Rajasthan. The company also has a 0.6mtpa white cement
plant in UAE to tap the growing Middle East and African markets. JKCem was the
first company to install a captive power plant in 1987 at Rajasthan and now it has
total power capacity of 140MW. The company sells cement under the brands - JK
Cement and JK Super Cement.
Exhibit 20: Plant Locations
Grey Cement Capacity
Plant Location
State
Region
Capacity (MTPA)
Nimbahera
Rajasthan
North
3.25
Mangrol*
Rajasthan
North
2.25
Gotan
Rajasthan
North
0.5
Jhajjar*
Haryana
North
1.5
Muddapur
Karnataka
South
3
Total Grey Cement Capacity
10.5
White Cement Capacity
Plant Location
State
Region
Capacity (MTPA)
Gotan
Rajasthan
North
0.6
UAE
0.6
Total White Cement Capacity
1.2
Source: Company, Angel Researc; Note: *New capacity (1.5mtpa at each location)added during 1HFY2015
March 12, 2015
8
Initiating coverage | JK Cement
Profit & Loss Statement (Standalone)
Y/E March (` cr)
FY2013
FY2014
FY2015E FY2016E FY2017E
Net Sales
2,904
2,782
3,378
4,077
4,772
% chg
14.4
(4.2)
21.5
20.7
17.0
Total Expenditure
2,352
2,421
2,931
3,411
3,913
Net Raw Materials
362
425
564
668
765
Power & Fuel cost
714
674
813
948
1,092
Personnel
158
168
186
224
262
Other
1,118
1,155
1,368
1,571
1,793
EBITDA
552
361
448
666
860
% chg
8.7
(34.7)
24.1
48.8
29.1
(% of Net Sales)
19.0
13.0
13.2
16.3
18.0
Depreciation& Amortisation
128
134
147
182
208
EBIT
424
227
300
484
652
% chg
10.9
(46.5)
32.6
61.1
34.6
(% of Net Sales)
14.6
8.1
8.9
11.9
13.7
Interest & other Charges
140
153
221
288
248
Other Income
57
62
61
28
22
(% of PBT)
16.6
45.7
43.4
12.5
5.1
Recurring PBT
341
136
141
224
425
% chg
16.0
(60.0)
3.2
59.1
89.9
Extraordinary Expense/(Inc.)
-
-
-
-
-
PBT (reported)
341
136
141
224
425
Tax
107
39
21
67
127
(% of PBT)
31.4
28.8
15.0
30.0
30.0
PAT (reported)
234
97
120
157
297
ADJ. PAT
234
97
120
157
297
% chg
26.1
(58.5)
23.2
31.1
89.9
(% of Net Sales)
8.0
3.5
3.5
3.8
6.2
Basic EPS (`)
33
14
17
22
43
Fully Diluted EPS (`)
33
14
17
22
43
% chg
21.0
(58.5)
23.2
31.1
89.9
March 12, 2015
9
Initiating coverage | JK Cement
Balance Sheet (Standalone)
Y/E March (` cr)
FY2013
FY2014
FY2015E FY2016E FY2017E
SOURCES OF FUNDS
Equity Share Capital
70
70
70
70
70
Reserves& Surplus
1,627
1,689
1,780
1,900
2,128
Shareholders Funds
1,697
1,758
1,850
1,970
2,198
Total Loans
1,272
2,320
2,620
2,395
2,120
Deferred Tax Liability
249
268
268
268
268
Other Long term liabilities
87
97
97
97
97
Total Liabilities
3,305
4,445
4,836
4,731
4,684
APPLICATION OF FUNDS
Gross Block
3,087
3,180
4,900
5,050
5,200
Less: Acc. Depreciation
722
868
1,015
1,197
1,405
Net Block
2,364
2,313
3,886
3,854
3,796
Capital Work-in-Progress
108
1,102
82
82
82
Investments
169
300
300
300
300
Current Assets
1,261
1,389
1,360
1,335
1,402
Inventories
461
542
615
687
756
Sundry Debtors
115
112
131
147
172
Cash
332
348
189
85
61
Loans & Advances
345
373
411
402
398
Other
7
14
14
14
14
Current liabilities
597
658
791
839
895
Net Current Assets
664
731
569
496
507
Total Assets
3,305
4,445
4,836
4,731
4,684
March 12, 2015
10
Initiating coverage | JK Cement
Cash Flow Statement (Standalone)
Y/E March
FY2013
FY2014
FY2015E FY2016E FY2017E
Profit before tax
341
136
141
224
425
Depreciation
128
134
147
182
208
Change in Working Capital
(123)
(51)
3
(31)
(35)
Less: Other income
57
62
61
28
22
Direct taxes paid
107
39
21
67
127
Cash Flow from Operations
182
117
209
279
449
(Inc)/ Decin Fixed Assets
(209)
(1,088)
(700)
(150)
(150)
(Inc)/ Dec in Investments
(158)
(130)
-
-
-
Other income
57
62
61
28
22
Cash Flow from Investing
(311)
(1,156)
(639)
(122)
(128)
Issue of Equity
Inc./(Dec.) in loans
84
1,078
300
(225)
(275)
Dividend Paid (Incl. Tax)
53
25
28
37
70
Others
2
(0)
-
-
-
Cash Flow from Financing
28
1,054
272
(262)
(345)
Inc./(Dec.) in Cash
(100)
15
(158)
(104)
(24)
Opening Cash balances
433
332
348
189
85
Closing Cash balances
332
348
189
85
61
March 12, 2015
11
Initiating coverage | JK Cement
Key Ratios
Y/E March
FY2013
FY2014
FY2015E
FY2016E
FY2017E
Valuation Ratio (x)
P/E (on FDEPS)
20.2
48.5
39.4
30.0
15.8
P/CEPS
13.0
20.4
17.7
13.9
9.3
P/BV
2.8
2.7
2.5
2.4
2.1
Dividend yield (%)
1.0
0.4
0.5
0.7
1.3
EV/Sales
1.9
2.0
2.1
1.7
1.4
EV/EBITDA
10.2
15.4
15.7
10.4
7.7
EV / Total Assets
1.7
1.2
1.5
1.5
1.4
Per Share Data (`)
EPS (Basic)
33.4
13.9
17.1
22.4
42.5
EPS (fully diluted)
33.4
13.9
17.1
22.4
42.5
Cash EPS
51.7
33.0
38.1
48.4
72.3
DPS
6.5
3.0
3.4
4.5
8.5
Book Value
242.7
251.5
264.6
281.7
314.3
Dupont Analysis
EBIT margin
14.6
8.1
8.9
11.9
13.7
Tax retention ratio
68.6
71.2
85.0
70.0
70.0
Asset turnover (x)
1.0
0.8
0.8
0.9
1.0
ROIC (Post-tax)
10.4
4.6
5.8
7.3
9.8
Cost of Debt (Post Tax)
7.7
6.0
7.6
8.1
7.7
Leverage (x)
0.5
0.7
1.1
1.1
0.9
Operating ROE
11.7
3.5
4.0
6.5
11.8
Returns (%)
ROCE (Pre-tax)
13.3
5.8
6.5
10.1
13.8
Angel ROIC (Pre-tax)
16.2
8.4
8.6
11.4
15.3
ROE
16.9
6.4
7.0
8.2
14.3
Turnover ratios (x)
Asset Turnover (Gross Block)
1.0
0.9
0.8
0.8
0.9
Inventory / Sales (days)
52
66
62
58
55
Receivables (days)
13
15
13
12
12
Payables (days)
87
95
90
87
81
WC cycle (ex-cash) (days)
34
47
41
35
33
Solvency ratios (x)
Net debt to equity
0.5
1.0
1.2
1.0
0.8
Net debt to EBITDA
1.4
4.6
4.8
3.0
2.0
Interest Coverage (EBIT / Int.)
3.0
1.5
1.4
1.7
2.6
March 12, 2015
12
Initiating coverage | JK Cement
Research Team Tel: 022 - 39357800
DISCLAIMER
Angel Broking Private Limited (hereinafter referred to as “Angel”) is a registered Member of National Stock Exchange of India Limited,
Bombay Stock Exchange Limited and MCX Stock Exchange Limited. It is also registered as a Depository Participant with CDSL and
Portfolio Manager with SEBI. It also has registration with AMFI as a Mutual Fund Distributor. Angel has received in-principal approval
from SEBI for registering as a Research Entity in terms of SEBI (Research Analyst) Regulations, 2014. Angel or its associates has not
been debarred/ suspended by SEBI or any other regulatory authority for accessing /dealing in securities Market. Angel or its associates
including its relatives/analyst do not hold any financial interest/beneficial ownership of more than 1% in the company covered by
Analyst. Angel or its associates/analyst has not received any compensation / managed or co-managed public offering of securities of
the company covered by Analyst during the past twelve months. Angel/analyst has not served as an officer, director or employee of
company covered by Analyst and has not been engaged in market making activity of the company covered by Analyst.
This document is solely for the personal information of the recipient, and must not be singularly used as the basis of any investment
decision. Nothing in this document should be construed as investment or financial advice. Each recipient of this document should
make such investigations as they deem necessary to arrive at an independent evaluation of an investment in the securities of the
companies referred to in this document (including the merits and risks involved), and should consult their own advisors to determine
the merits and risks of such an investment.
Reports based on technical and derivative analysis center on studying charts of a stock's price movement, outstanding positions and
trading volume, as opposed to focusing on a company's fundamentals and, as such, may not match with a report on a company's
fundamentals.
The information in this document has been printed on the basis of publicly available information, internal data and other reliable
sources believed to be true, but we do not represent that it is accurate or complete and it should not be relied on as such, as this
document is for general guidance only. Angel Broking Pvt. Limited or any of its affiliates/ group companies shall not be in any way
responsible for any loss or damage that may arise to any person from any inadvertent error in the information contained in this report.
Angel Broking Pvt. Limited has not independently verified all the information contained within this document. Accordingly, we cannot
testify, nor make any representation or warranty, express or implied, to the accuracy, contents or data contained within this document.
While Angel Broking Pvt. Limited endeavors to update on a reasonable basis the information discussed in this material, there may be
regulatory, compliance, or other reasons that prevent us from doing so.
This document is being supplied to you solely for your information, and its contents, information or data may not be reproduced,
redistributed or passed on, directly or indirectly.
Neither Angel Broking Pvt. Limited, nor its directors, employees or affiliates shall be liable for any loss or damage that may arise from
or in connection with the use of this information.
Note: Please refer to the important `Stock Holding Disclosure' report on the Angel website (Research Section). Also, please refer to the
latest update on respective stocks for the disclosure status in respect of those stocks. Angel Broking Pvt. Limited and its affiliates may
have investment positions in the stocks recommended in this report.
Disclosure of Interest Statement
JK Cement
1. Analyst ownership of the stock
No
2. Angel and its Group companies ownership of the stock
No
3. Angel and its Group companies' Directors ownership of the stock
No
4. Broking relationship with company covered
No
Note: We have not considered any Exposure below ` 1 lakh for Angel, its Group companies and Directors
Ratings (Based on expected returns
Buy (> 15%)
Accumulate (5% to 15%)
Neutral (-5 to 5%)
over 12 months investment period):
Reduce (-5% to -15%)
Sell (< -15
March 12, 2015
13